- HFSS15在線幫助
- 首頁
- HFSS教學(xué)
- HFSS 15 在線幫助文檔
Technical Notes > Transient Solution Theory
Excitations in Time Domain
Excitations available in HFSS Transient are wave ports, lumped ports, voltage sources, current sources and incident waves. In the case of ports, the modal port solution is provided by the same 2D port solver as is used in HFSS Frequency Domain. If a lossy dielectric or a non-perfectly conducting metal touches the port, the port impedance will be frequency dependent. A frequency-dependent excitation poses a problem to any time-domain solver. HFSS Transient, as well as some competing time-domain codes, uses the mode belonging to the lossless case as an excitation in the port.
In order to deal with higher-order modes or with frequency-dependent (lossless) modes, e.g. in wave guides, HFSS Transient takes advantage of the trans-finite element method [ ], which has always been an important technique in HFSS Frequency Domain. In HFSS Transient, elements touching the ports are set aside in an implicit time-stepping scheme that is close to the FETD method. Since this is a small fraction of the total number of elements, the penalty for solving the matrix equation is negligible, while the implicit method allows large time steps. The upshot is that higher-order modes and frequency-dependent (lossless) modes are handled accurately.
In a standard HFSS simulation a port excitation is the equivalent of an excited infinite transmission line connected to the port face. For a modal project this is easy to visualize but in a terminal project the user defines the input voltage. This raises the question of how this input voltage is applied to the port for terminal designs. While the following discussion is directed to transient simulations, it is also applicable to HFSS terminal designs where the Incident Voltage option in Edit Sources is used.
To derive the correct model for a terminal port, first consider the transmission line section shown in Figure 1. The port is at the point 0-0 and to the left is the equivalent infinitely long feed line.
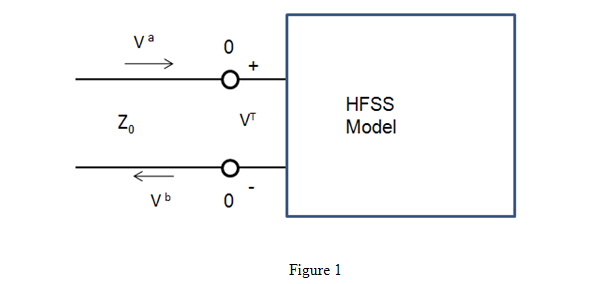
For this model then Va is the incident voltage and Vb is the reflected voltage seen at the port. We know from the definition of voltage and current on a transmission line that for the total voltage, VT, the following is true:
|
VT = Va + Vb |
(1) |
If the characteristic impedance of the line is equal to Z0 then we also know:
|
Z0I = Va - Vb |
(2) |
If we add equations (1) and (2) we find that at point 0-0:
|
VT + Z0I = 2Va |
(3) |
If we apply Kicrchkoff's voltage law to the equivalent circuit shown in Figure 2 we see it yields the result shown in (3). This is the port model for a terminal port in HFSS.
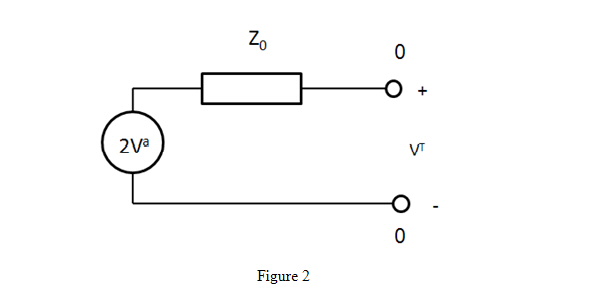
To be consistent then the same terminal port excitation is used in HFSS Transient. Therefore if you define an incident voltage signal in the transient setup that signal is applied to the 3D model as a voltage source of twice the user defined amplitude in series with the terminal impedance.
Note |
As a consequence of the above discussion, one needs to be careful when comparing results with a circuit tool or textbooks using the voltage source shown in Figure 2. If one volt is used for the voltage source in the circuit simulator, this should be compared with a HFSS transient simulation with edit sources set to 0.5 volt. |
Before considering an example one more point needs to be made. In the reporter for HFSS Transient when plotting the voltage at a given port the options are Input( ) and Output( ). Input is the user defined incident voltage (Va in the Figure 2) and Output is the reflected voltage (Vb = VT - Va). We can see then that to view the total voltage at the port terminals one needs to create an output variable that is the sum of Input ( ) and Output( ). We will consider two examples to illustrate this.
Consider the HFSS Transient model of a simple coax shown in the Figure 3. It is an air filled 50W line that has a center section with a smaller inner radius that results in an impedance of 91.5 ohm in that part of the line. Each section of this air filled coax (the two 50 W and the one 91.5 ohm sections) has a length of 100mm. This length has a time delay of 1/3 nS. This was simulated in HFSS Transient using the incident voltage signal shown in the inset for Figure 3.
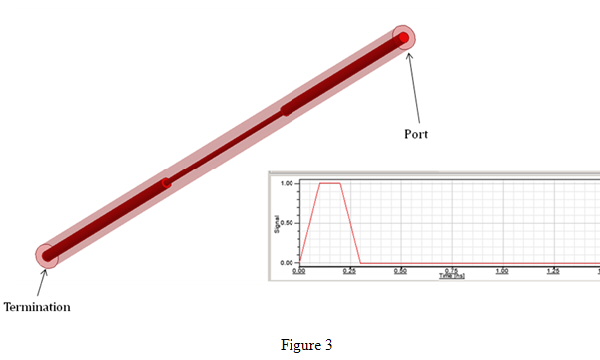
This model was simulated with a single 50 W terminal port on one end and a matched termination on the opposite end. The response seen at the port is shown below in Figure 4.
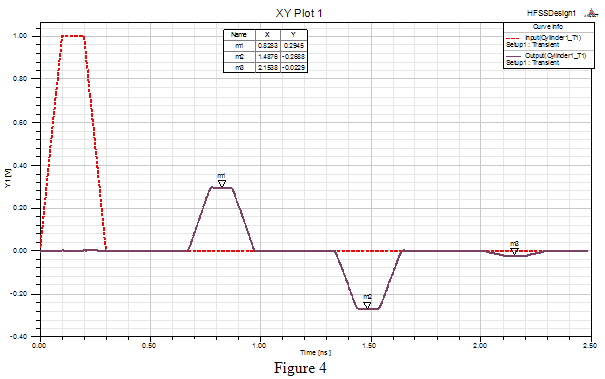
Figure 4 shows the Input and Output signals at the port terminal (Cylinder1_T1). Remember that Input( ) is the incident signal as shown in Figure 3. If one uses the equations for reflection and transmission to compute the amplitude of the signal at the 3 points shown in the figure these textbook equations would give 0.29, -0.27,-.02 respectively. We can see that the reflected voltage is accurately computed for the applied signal.
For an example where one might be more interested in the total voltage a second case was considered. The same HFSS Transient model was simulated with the same incident signal, but this time the port terminal impedance was set to 30 W. The HFSS Transient response for this simulation is shown in the Figure 5.
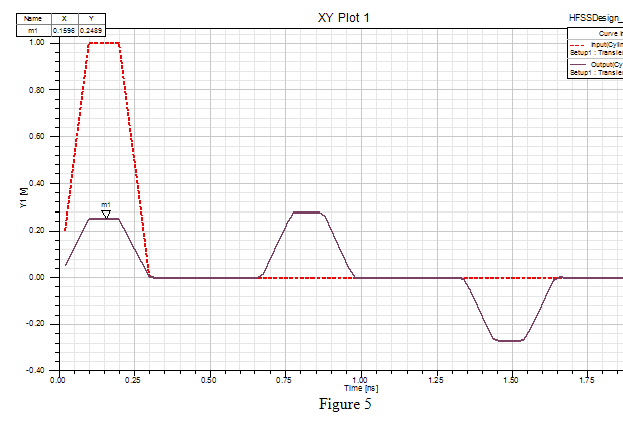
For the time between 0.1 - 0.2 nS the textbook response says that VT should be 1.25V. Again that is the total voltage and if you add together the 2 curves shown in the plot you would get the correct response of 1.25V in that range.
Related Topics
Transient Solution Theory
Discontinuous Galerkin Finite Element Method
Local Time Stepping
Materials in Time Domain
Analysis Setup in Time Domain
References for Time Domain
-

國內(nèi)最全面的HFSS培訓(xùn)課程,包含7套視頻教程和2本教材,資深專家講解,視頻操作演示,結(jié)合最新工程案例,讓HFSS學(xué)習(xí)不再難...【詳細(xì)介紹】


